NBA Playoff Predictions Update 4 (5-3)
This is update 4 to my original post about predicting the [NBA playoffs with R](http://viksalgorithms.blogspot.com/2012/05/predicting-nba-finals- with-r.html). With the Thunder beating the Spurs and the Heat losing to the Celtics, the algorithm went 1-1 on predictions, making it 5-3 so far.
Making some improvements
I have been posting for some time about incorporating more data into the models, and I finally got around to it. It is a common truism in data science that more (high-quality) data almost always leads to a better model, and it is no exception here. The fact that the 2011-2012 season was strike-shortened also meant that only relying on data from this season really limited the potential of the algorithm.
I decided to start slowly, and incorporate data from both the 2010-2011 season, and the 2011-2012 season. Due to the aforementioned strike, this actually increases the data available by 128% overall. I made no other tweaks to the algorithm in this time, so this is a good test of how much value additional data on its own can add.
The new accuracy value across both seasons is 65.6%, which means that it is predicting 1.91 times as many winners as losers. Here is the confusion matrix:
 Differences between seasons
I thought it would be interesting to look at p-values between different season statistics to see if there were any significant differences between the 2010-2011 season and the 2011-2012 season. A big deal is always made about how the lockout affected different statistics, but I haven’t seen any analysis on it yet.
We can easily do a t-test on each column of the data frame with all of the per team statistics:
p_vals<-foreach(i=7:ncol(frame_2011)) %do%
{
 t.test(frame_2011[,i],frame_2012[,i])$p.value
}
We end up with a table of each calculated statistic the p-values associated with each one. A p-value indicates if there is a statistically significant difference between two distributions. In this case, we might be looking to see whether there is a statistically significant difference between rebounding in the 2010-2011 season, and the 2011-2012 season. The test gave back some interesting results. Here are some of them:
There was a very significant difference in the number of players who fouled out between the two seasons. In 2012, far fewer players fouled out than in 2011. Also, less personal fouls were assessed overall, which also dropped the number of free throws attempted.
Starters played significantly more unique positions in 2012. For example, if the starting lineup consists of a C, a PF, an SF, an SG/SF, and a PG, there are 5 unique positions. On the other hand, if it consists of a PF, a PF, an SF/SG, an SF/SG, and a PG, that is only 3 unique positions. I am not sure why this increased between seasons, but maybe it indicates the rise of more true centers? Maybe a different way of keeping track of positions?
3 point percentage went down significantly from 2010-2011 to 2011-2012. Less practice time? Not clear why this happened.
Rebounding went up overall, as did defensive rebounding.
Starters played less minutes in 2011-2012 than in 2010-2011.
Predictions for Tonight
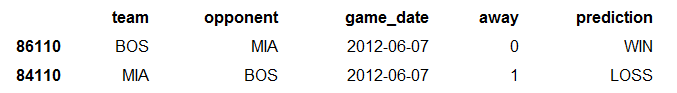
And finally, the algorithm is predicting Boston to win tonight: